Peaks Over Threshold
Peaks Over Threshold (POT) extreme values are extracted from time series
by first generating a time series of exceedances by selecting values above
(or below for extremes_type="low") a certain threshold
and then declustering the exceedance time series by identifying clusters
separated by a given time period and then selecting only the highest (lowest)
values within each cluster. Declustering is performed in order to ensure
that these values are IID (independent and identically distributed) which is required
for the corresponding limit distribution to be applicable.
The POT extreme values asymptotically follow the
Generalized Pareto Distribution
famliy, according to the
Pickands–Balkema–De Haan theorem.
Extracting Extremes
As outlined in the Read First section of this documentation,
there are multiple ways the same thing can be achieved in pyextremes.
The POT extraction function can be accessed via:
pyextremes.extremes.peaks_over_threshold.get_extremes_peaks_over_threshold- the lowest levelpyextremes.get_extremes- general-purpose extreme value extraction functionpyextremes.EVA.get_extremes- helper-class (extreme values are not returned by this function, but instead are set on theEVAinstance in the.extremesattribute)
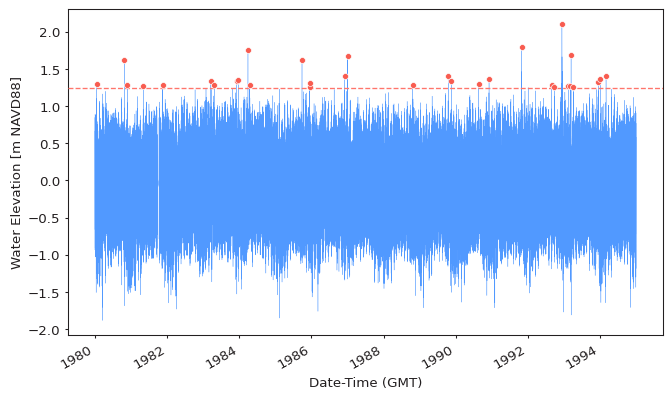
The simplest way to extract extreme values using BM method is to use the default
parameters of the get_extremes function:
from pyextremes import get_extremes
from pyextremes.plotting import plot_extremes

extremes = get_extremes(data, "POT", threshold=0.5, r="12h")
plot_extremes(
    ts=data,
    extremes=extremes,
    extremes_method="POT",
    extremes_type="high",
    threshold=0.5,
    r="12h",
)
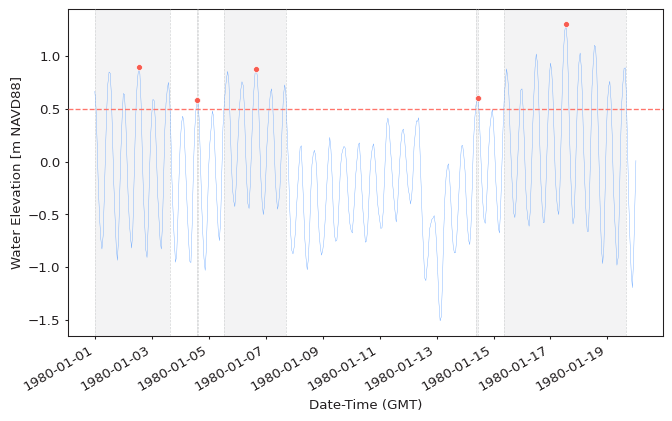
from pyextremes import EVA

model = EVA(data=data)
model.get_extremes("POT", threshold=0.5, r="12h")
model.plot_extremes(show_clusters=True)
Note
You can get the data variable referenced above by running the following code:
data = pd.read_csv(
    "battery_wl.csv",
    index_col=0,
    parse_dates=True,
).squeeze()
data = (
    data
    .sort_index(ascending=True)
    .astype(float)
    .dropna()
    .loc[pd.to_datetime("1980/01/01"):pd.to_datetime("1980/01/20")]
)
data = (
  data - (data.index.array - pd.to_datetime("1992"))
) / pd.to_timedelta("365.2425D") * 2.87e-3
"battery_wl.csv"
can be downloaded here.
All figures shown in this tutorial section were generated using this jupyter notebook.
The get_extremes function uses the following parameters:
- ts - time series (
pandas.Series) from which the extreme values are extracted - method - extreme value extraction method:
"BM"for Block Maxima and"POT"for Peaks Over Threshold. - extremes_type - extreme value type:
"high"for above threshold (default) and"low"for below threshold.
The following paramters are used only when method="POT":
- threshold - threshold value.
- r - minimum time distance (window duration) between adjacent clusters. Used
to decluster exceedances by locating clusters where all exceedances are separated
by distances no more than
rand then locating maximum or minimum (depends onextremes_type) values within each cluster. By defaultr="24h"(24 hours).
If we specify all of these parameters then the function would look as:
get_extremes(
    ts=data,
    method="POT",
    extremes_type="high",
    threshold=0.5,
    r="12h",
)
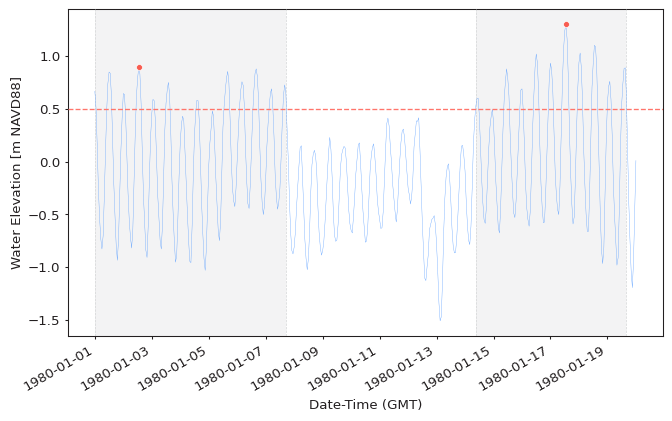
Declustering
As described earlier, declustering is controlled using the r argument.
The goal of declustering is to ensure that all extreme values are IID, which is
a requirement for the GPD model to be valid. Shown below is an example of extremes
extracted from the same data and using the same threshold as above, but with a larger
r value:
extremes = get_extremes(data, "POT", threshold=0.5, r="24h")
plot_extremes(
    ts=data,
    extremes=extremes,
    extremes_method="POT",
    extremes_type="high",
    threshold=0.5,
    r="24h",
)
model = EVA(data=data)
model.get_extremes("POT", threshold=0.5, r="24h")
model.plot_extremes(show_clusters=True)
Tip
Declustering value of r="24h" was selected as a default value because
pyextremes was developed when working with meteorological phenomena - namely,
storms. Extreme storm surge and waves are generally caused by a storm event which
generally doesn't exceed 12-24 hours and, because of this, the assumption of 24-hour
inter-cluster distance results in a reasonably good separation of independent
storm events.
User is advised to select this parameter based on the properties of studied phenomena. For example, extreme precipitation events in some regions of the world can last for more than several days and, because of this, the default value of 24 hours would not be adequate for such analysis.
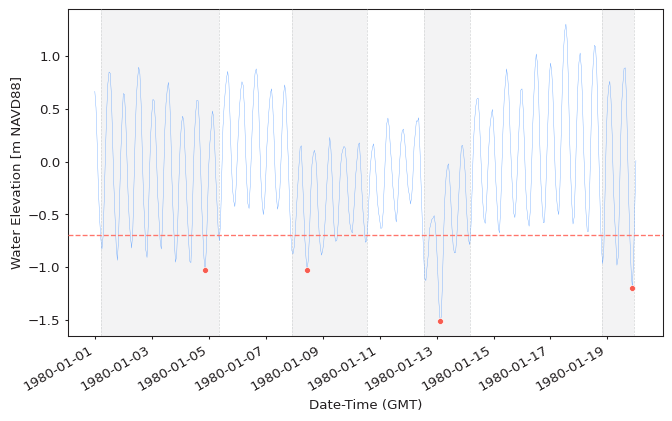
Peaks Below Threshold
A special case of Peaks Over Threshold is when instead of selecting values above
the threshold we select values below it. Such values can be extracted
by setting the extremes_type argument to "low":
extremes = get_extremes(
    data,
    "POT",
    threshold=0.5,
    r="24h",
    extremes_type="low",
)
plot_extremes(
    ts=data,
    extremes=extremes,
    extremes_method="POT",
    extremes_type="low",
    threshold=0.5,
    r="24h",
)
model = EVA(data=data)
model.get_extremes("POT", threshold=0.5, r="24h", extremes_type="low")
model.plot_extremes(show_clusters=True)
Tip
The pyextremes.EVA class works identically for both peaks over and below
threshold series and properly reflects (rotates) the data to fit
statistical distributions.
This is true as long as the extremes_type argument is correctly specified.
Warning
When analyzing POT with extremes_type="low" be mindful of your data
being censored. An example of this would be water level time series - water levels
cannot go below the seabed and will, therefore, be censored by the seabed elevation.
Such series would no longer follow the GPD and any results of such analysis
would be unreliable.