Goodness of Fit
Diagnostic plots show how well a model fits the data, but judging them is subjective. Goodness-of-fit tests provide a formal answer to a narrower question: is there enough evidence to reject the hypothesis that the extreme values follow the fitted distribution?
Kolmogorov-Smirnov Test
The Kolmogorov-Smirnov test (KS test) compares the empirical cumulative distribution function (CDF) of the extreme values with the CDF of the fitted distribution. The test statistic \(D\) is the largest vertical distance between the two:
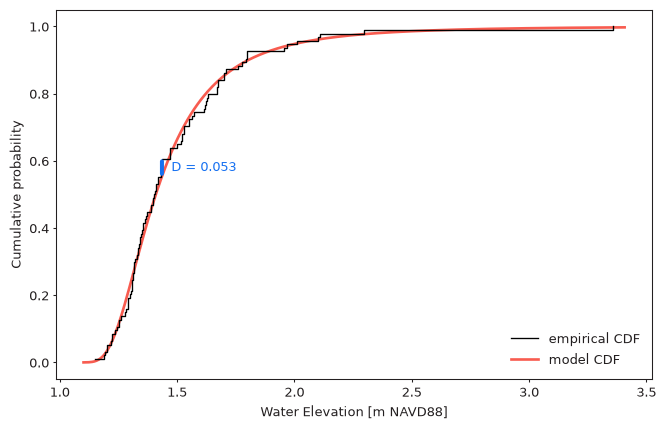
If \(D\) is larger than a critical value, which depends on the number of
extreme values and the significance level, the hypothesis that the data follows
the distribution is rejected. The test is run using the test_ks method:
                      Kolmogorov-Smirnov Test
-------------------------------------------------------------------
Null hypothesis: data follows genextreme distribution
Alternative hypothesis: data doesn't follow genextreme distribution

Test statistic: D = 0.05306810534431272
p-value: 0.9411006976772275

Significance level: 0.05
Critical value: 0.13817793700169734
Critical region: reject null-hypothesis if D > 0.13817793700169734

Test result: data follows genextreme distribution
-------------------------------------------------------------------
Note
You can get the data variable referenced above by running the following code:
import pandas as pd

data = pd.read_csv(
    "battery_wl.csv",
    index_col=0,
    parse_dates=True,
).squeeze()
data = (
    data
    .sort_index(ascending=True)
    .astype(float)
    .dropna()
    .loc[pd.to_datetime("1925"):]
)
data = (
    data
    - (data.index.array - pd.to_datetime("1992"))
    / pd.to_timedelta("365.2425D")
    * 2.87e-3
)
"battery_wl.csv"
can be downloaded here.
The test_ks method takes a single argument, significance_level
(by default 0.05), and returns a test object with the following attributes:
| Attribute | Description |
|---|---|
test_statistic |
KS statistic \(D\) |
pvalue |
p-value of the test |
critical_value |
critical value of \(D\) for the given significance level |
success |
True if the null hypothesis is not rejected (\(D \leq\) critical_value) |
The test object can also be used directly in a condition
(e.g. if model.test_ks(): ...), in which case it evaluates to success.
The KS test can be used with any extreme value type and model. For example, all of the models fitted in the previous sections pass it:
| Extremes | Distribution | \(D\) | p-value | Result |
|---|---|---|---|---|
| BM, 1 year | genextreme |
0.053 | 0.941 | not rejected |
| BM, 1 year | gumbel_r |
0.114 | 0.164 | not rejected |
| POT, threshold 1.5 m, r = 24 h | genpareto |
0.084 | 0.886 | not rejected |
Limitations
The table above shows that the Gumbel distribution passes the KS test, even though it clearly fails to describe the largest water levels (see the Q-Q plot) and has a much higher AIC than GEVD (see Distributions). This illustrates the main limitations of the KS test in EVA:
- Insensitivity to the tail. \(D\) is usually largest in the middle of the distribution, where the CDF changes the fastest. Misfit of the few largest values, which matter the most for return values, barely changes \(D\).
- Estimated parameters. The standard critical values assume that the distribution parameters are known in advance. When the parameters are fitted to the same data, the fitted CDF is closer to the data than the true one, so the test rejects less often than it should and p-values are too high.
- Small samples. With few extreme values the critical value is large, so only a grossly wrong distribution is rejected.
Warning
Not rejecting the null hypothesis doesn't prove that the model is correct - it only means that the test didn't find evidence against it. Use the KS test to catch gross errors (e.g. a wrong distribution or a mistake in extracting extreme values), and rely on diagnostic plots, AIC, confidence intervals, and comparisons between models and thresholds to assess the model in more detail.
Standalone Usage
The test is implemented in the KolmogorovSmirnov class, which can be used
with any extreme values and distribution parameters:
from pyextremes import get_extremes, get_model
from pyextremes.tests import KolmogorovSmirnov

extremes = get_extremes(data, "BM", block_size="365.2425D")
model = get_model(model="MLE", extremes=extremes, distribution="genextreme")
test = KolmogorovSmirnov(
    extremes=extremes,
    distribution="genextreme",
    fit_parameters=model.fit_parameters,
    significance_level=0.05,
)
Note
fit_parameters must contain all distribution parameters,
including fixed ones (e.g. {**model.fit_parameters, "loc": 1.5} if
the location was fixed with floc=1.5). For extreme low values,
the extremes must first be transformed the same way EVA does it
(see Extreme Low Values).