Overview
Once extreme values are extracted, the next step is to fit a statistical model to them. Fitting a model means finding parameters of a continuous probability distribution (e.g. shape, location, and scale of the GEVD) which best describe the observed extreme values. The fitted distribution is then used to estimate return values for return periods well beyond the length of the observed record (e.g. a 100-year water level from 50 years of data).
In pyextremes a model is the method used to estimate distribution parameters
(e.g. MLE or MCMC), while a distribution is the probability distribution whose
parameters are estimated (e.g. GEVD or GPD). The two are chosen independently:
any supported model can be used with any continuous distribution.
Available Models
| Model | Method | Confidence intervals | Section |
|---|---|---|---|
MLE |
Maximum Likelihood Estimate | bootstrap | Maximum Likelihood |
Emcee |
Markov Chain Monte Carlo | posterior samples | Markov Chain Monte Carlo |
MOM |
Method of Moments | bootstrap | Moments and L-moments |
Lmoments |
L-moments | bootstrap | Moments and L-moments |
MLE is the default model. It is fast, well understood, and is the method used
throughout the classic EVA literature (e.g. Coles, 2001).
Tip
If you are not sure which model to use, start with the defaults (MLE and
automatically selected distribution) and then use Emcee to check whether
a Bayesian estimate agrees with the frequentist one.
As discussed in Extreme Value Types,
different correctly applied methods should converge to similar answers.
Fitting a Model
As outlined in the Read First section of this documentation,
there are multiple ways the same thing can be achieved in pyextremes.
A model can be fitted via:
pyextremes.get_model- standalone function which takes a series of extreme values and returns a fitted model objectpyextremes.EVA.fit_model- helper-class method (the model is not returned by this method, but instead is set on theEVAinstance in the.modelattribute)
The simplest way to fit a model is to use the default parameters:
Note
You can get the data variable referenced above by running the following code:
import pandas as pd

data = pd.read_csv(
    "battery_wl.csv",
    index_col=0,
    parse_dates=True,
).squeeze()
data = (
    data
    .sort_index(ascending=True)
    .astype(float)
    .dropna()
    .loc[pd.to_datetime("1925"):]
)
data = (
    data
    - (data.index.array - pd.to_datetime("1992"))
    / pd.to_timedelta("365.2425D")
    * 2.87e-3
)
"battery_wl.csv"
can be downloaded here.
All figures shown in the Fitting Models sections were generated using
the code shown in these sections and the data defined above.
Warning
The standalone get_model function fits the distribution to the extreme values
exactly as provided. EVA performs a few extra steps behind the scenes:
it selects the distribution automatically, fixes the location parameter
for the GPD and Exponential distributions (see Distributions),
and transforms extreme low values (extremes_type="low")
so that they can be modeled using the same distributions as extreme high values.
When working with extreme low values it is recommended to use EVA.
The EVA.fit_model method uses the following parameters:
- model - model name, one of
"MLE"(default),"Emcee","MOM", or"Lmoments". - distribution - name of a distribution from
scipy.stats(e.g."genextreme") or ascipy.stats.rv_continuousobject. By default the distribution is selected automatically based on the extreme value extraction method. See Distributions. - distribution_kwargs - dictionary with distribution parameters to be held fixed,
e.g.
{"fc": 0}or{"floc": 1.5}. By default the location parameter is fixed for the GPD and Exponential distributions. See Distributions. - kwargs - additional keyword arguments passed to the model.
Only the
Emceemodel accepts additional arguments:n_walkers,n_samples,progress, andpool. See Markov Chain Monte Carlo.
The standalone get_model function takes the same arguments,
except that it requires extremes and an explicit distribution,
and doesn't fix any parameters unless distribution_kwargs is provided.
Note
Calling fit_model again replaces the previously fitted model.
Extracting extreme values again (get_extremes) removes the fitted model,
because it is no longer valid for the new extreme values.
Inspecting the Model
Printing an EVA instance shows a summary of the data, extreme values,
and the fitted model:
                           Univariate Extreme Value Analysis
========================================================================================
                                      Source Data
----------------------------------------------------------------------------------------
Data label:    Water Elevation [m NAVD88]      Size:                             796,751
Start:                      November 1926      End:                           March 2020
========================================================================================
                                     Extreme Values
----------------------------------------------------------------------------------------
Count:                                 94      Extraction method:                     BM
Type:                                high      Block size:             365 days 05:49:12
========================================================================================
                                         Model
----------------------------------------------------------------------------------------
Model:                                MLE      Distribution:                  genextreme
Log-likelihood:                    18.026      AIC:                              -29.786
----------------------------------------------------------------------------------------
Free parameters:                 c=-0.266      Fixed parameters: All parameters are free
                                loc=1.353
                              scale=0.146
========================================================================================
The fitted model and its properties are available as attributes:
| Attribute | Description |
|---|---|
model.model |
fitted model object (MLE, Emcee, MOM, or Lmoments) |
model.distribution |
distribution with its free and fixed parameters |
model.model.fit_parameters |
dictionary with fitted values of free parameters |
model.loglikelihood |
log-likelihood of the fitted model |
model.AIC |
corrected Akaike Information Criterion (smaller is better) |
When using the standalone get_model function, the same attributes
(distribution, fit_parameters, loglikelihood, and AIC)
are available directly on the returned model object.
{'c': np.float64(-0.2657081538950403), 'loc': np.float64(1.3530417941848183), 'scale': np.float64(0.14625409987106597)}
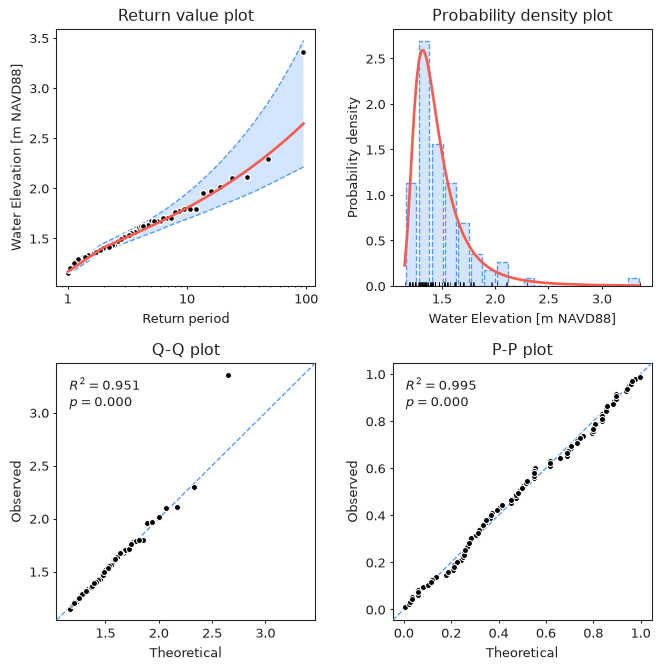
The quickest way to visually assess the fitted model is the diagnostic plot, which shows the return value plot, the probability density histogram, and the Q-Q and P-P plots (described in more detail in later sections):