Distributions
Extreme value theory tells us which distributions extreme values follow asymptotically, as the block size or threshold grows:
- Block Maxima follow the Generalized Extreme Value Distribution (GEVD), per the Fisher–Tippett–Gnedenko theorem
- Peaks Over Threshold follow the Generalized Pareto Distribution (GPD), per the Pickands–Balkema–De Haan theorem
Both distributions have a shape parameter which controls the behavior of the tail (i.e. how quickly return values grow with return period). When the shape parameter is zero, the GEVD reduces to the Gumbel distribution and the GPD reduces to the Exponential distribution. These are called degenerate cases: they have one parameter fewer and therefore produce narrower confidence intervals, but they cannot represent heavy (or bounded) tails.
pyextremes uses distributions from
scipy.stats,
which are referred to by name:
| Distribution | scipy.stats name |
Parameters | Used with |
|---|---|---|---|
| GEVD | genextreme |
c, loc, scale |
BM |
| Gumbel | gumbel_r |
loc, scale |
BM |
| GPD | genpareto |
c, loc, scale |
POT |
| Exponential | expon |
loc, scale |
POT |
Sign of the shape parameter
Extreme value literature (e.g. Coles, 2001) uses the shape parameter \(\xi\), where \(\xi > 0\) corresponds to a heavy (unbounded) upper tail and \(\xi < 0\) corresponds to a bounded upper tail.
genparetouses the same convention: \(c = \xi\).genextremeuses the opposite convention: \(c = -\xi\). For example,c=-0.266fitted below corresponds to \(\xi = 0.266\), which is a heavy-tailed (Fréchet-type) distribution.
Figures produced by pyextremes (e.g. MCMC trace and corner plots)
label the shape parameter as \(\xi\) but show the value of scipy's c.
Default Distribution
When the distribution argument of EVA.fit_model is not provided,
pyextremes fits two candidate distributions using the MLE model
and selects the one with the smallest
Akaike Information Criterion
(AIC):
genextremeorgumbel_rfor extremes extracted using Block Maximagenparetoorexponfor extremes extracted using Peaks Over Threshold (location parameter fixed at the threshold, see below)
The selected distribution is then fitted using the requested model.
The AIC used by pyextremes is corrected for small sample sizes (AICc):
where \(k\) is the number of free distribution parameters, \(\hat{L}\) is the maximized likelihood, and \(n\) is the number of extreme values. AIC rewards goodness of fit and penalizes the number of parameters, so the degenerate distribution is selected unless the extra shape parameter improves the fit enough to justify it.
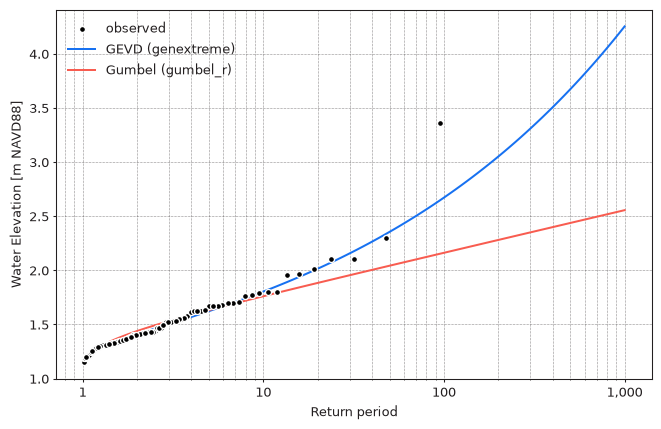
For the annual maxima of the Battery water levels, GEVD is clearly preferred:
| Distribution | AIC |
|---|---|
genextreme |
-29.786 |
gumbel_r |
-17.695 |
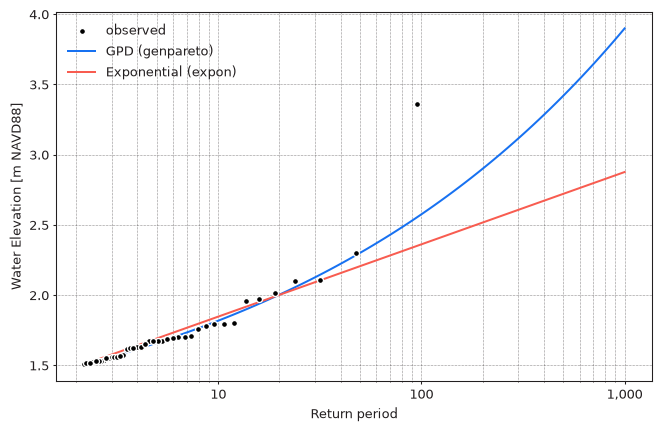
For the POT extremes above a threshold of 1.5 m (r="24h", see
Threshold Selection) the difference is much smaller,
but GPD is still preferred:
| Distribution | AIC |
|---|---|
genpareto |
-42.985 |
expon |
-41.776 |
Code used to produce the figures above
import matplotlib.pyplot as plt
import numpy as np
from pyextremes import EVA, get_return_periods
from pyextremes.plotting import pyextremes_rc

models = {}
for label, distribution in [
    ("GEVD (genextreme)", "genextreme"),
    ("Gumbel (gumbel_r)", "gumbel_r"),
]:
    models[label] = EVA(data)
    models[label].get_extremes("BM", block_size="365.2425D")
    models[label].fit_model(distribution=distribution)
    print(distribution, models[label].AIC)

observed = get_return_periods(
    ts=data,
    extremes=models["GEVD (genextreme)"].extremes,
    extremes_method="BM",
    extremes_type="high",
    block_size="365.2425D",
)
return_period = np.logspace(0.01, 3, 100)

with plt.rc_context(rc=pyextremes_rc):
    fig, ax = plt.subplots(figsize=(8, 5), dpi=96)
    ax.semilogx()
    ax.grid(True, which="both")
    ax.xaxis.set_major_formatter(plt.FuncFormatter(lambda x, _: f"{x:,.0f}"))
    ax.scatter(
        observed["return period"],
        observed.iloc[:, 0],
        s=20,
        lw=1,
        facecolor="k",
        edgecolor="w",
        zorder=20,
        label="observed",
    )
    for label, model in models.items():
        return_value, _, _ = model.get_return_value(return_period)
        ax.plot(return_period, return_value, lw=1.5, label=label)
    ax.set_xlabel("Return period")
    ax.set_ylabel(data.name)
    ax.legend(loc="upper left")
For POT the code is the same, with
get_extremes("POT", threshold=1.5, r="24h"),
distributions genpareto and expon,
and extremes_method="POT" without block_size.
Info
The automatic selection only chooses between a distribution and its degenerate case. It does not tell you whether the model is appropriate for your data - use the diagnostic plots and the stability checks described in Threshold Selection for that.
Selecting a Distribution
A distribution can be selected explicitly using the distribution argument:
Any continuous distribution from scipy.stats can be used, either by name
or by passing the distribution object (e.g. scipy.stats.genextreme).
Custom distributions can be provided by subclassing
scipy.stats.rv_continuous
and passing an instance of the subclass.
Warning
EVA issues a RuntimeWarning when a distribution other than genextreme
or gumbel_r is used with Block Maxima, or other than genpareto or expon
is used with Peaks Over Threshold. Other distributions (e.g. weibull_min
or lognorm) may fit the observed data well, but they have no theoretical
justification for extrapolating to rare events.
Fixing Parameters
Any distribution parameter can be fixed (frozen) to a given value,
in which case only the remaining (free) parameters are fitted.
Fixed parameters are passed via the distribution_kwargs argument
with names prefixed with f:
- fc - shape parameter(s), named after the parameter
(
cforgenextremeandgenpareto) - floc - location parameter
- fscale - scale parameter
One use of this feature is to investigate degenerate models. For example, GEVD with a shape parameter fixed at 0 is the Gumbel distribution:
The fitted location and scale parameters, log-likelihood, and AIC are identical
to those of gumbel_r.
Location Parameter in POT
Exceedances over a threshold can't be smaller than the threshold itself,
so the location parameter of the GPD and Exponential distributions
is equal to the threshold by definition. Because of this, when a genpareto or
expon distribution is fitted using EVA and distribution_kwargs is not
provided, the location parameter is fixed:
- at the threshold for extremes extracted using Peaks Over Threshold
- at the smallest extreme value for extremes extracted using Block Maxima
This leaves only the shape and scale parameters to be fitted:
To fit all parameters freely, pass an empty dictionary
(distribution_kwargs={}). Providing any distribution_kwargs
replaces the default, so {"fc": 0} for genpareto would leave
the location parameter free.
Note
The Lmoments model doesn't support fixed parameters,
so the location parameter is never fixed when using it.
See Moments and L-moments.